 NeuronCx
Reports and Analytics
Reports
Reports and dashboards for every transaction, cart and branch
CRM analytics built on the same record: lead volumes by source, how many transactions reach each phase, carts and payments by status, and each agent's and branch's workload, filtered by date, source or branch. Every count traces back to the transactions behind it.
Transaction trends by phase, stage, source and agent
See how many transactions arrived, how far they progressed and who owns them, broken down by phase, stage, source, branch or agent, and compared with any earlier period.
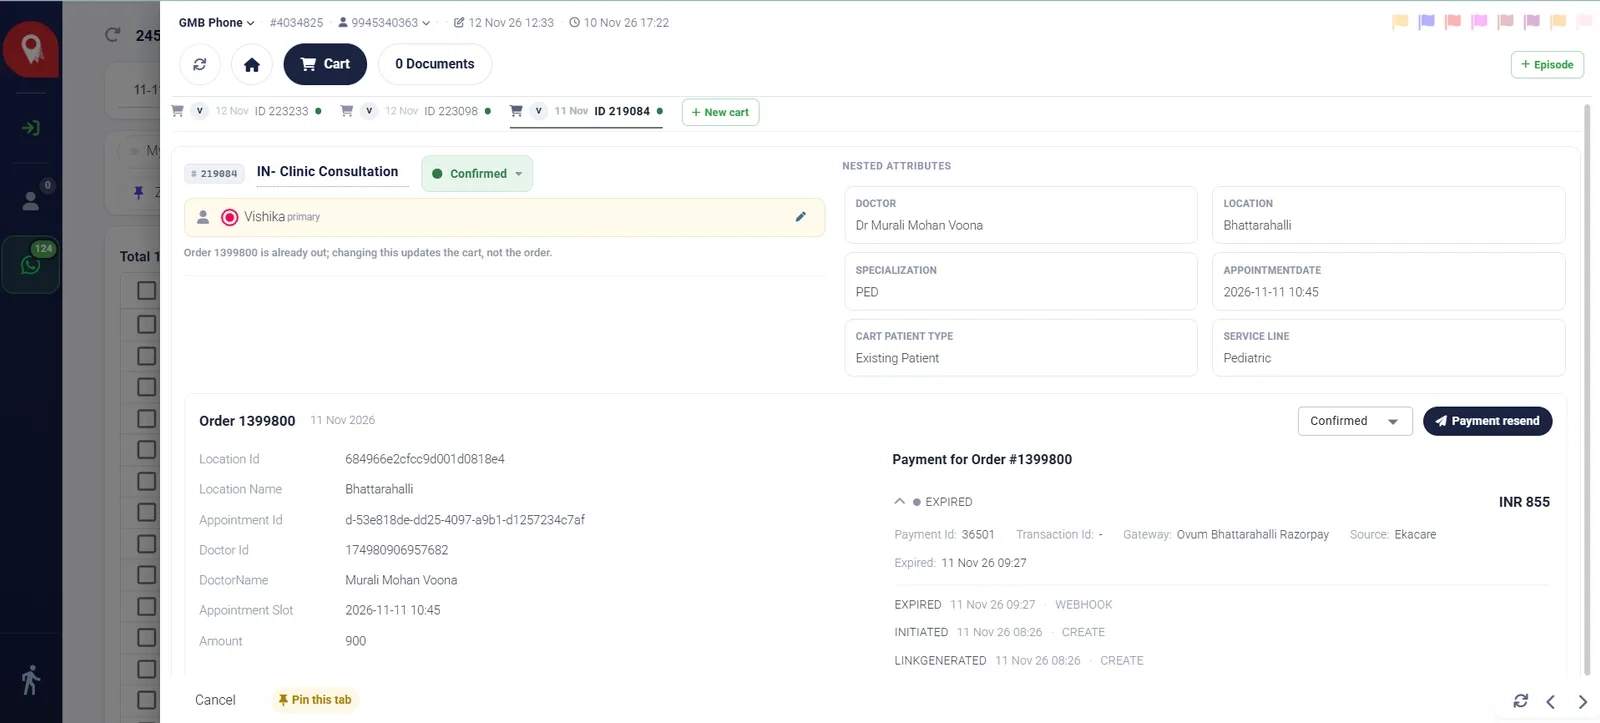
Cart and order conversion
Carts created and converted to paid orders, and acquisition, which counts each customer once at their first order. Group by agent, branch, line of business or location.
Source attribution from first touch to paid order
UTM, referral and promo-code tracking on every lead, carried through to the cart and order, so you can see which sources bring customers who actually book and pay.
Report builder, saved reports and scheduled exports
Filter and break down by any lead field, compare periods, set thresholds, save reports to My reports and schedule exports to arrive on the days you choose.
Drilldowns by line of business, cluster, branch and agent
Reports follow your organisation, so a cluster supervisor sees their own cluster and the central team sees every branch side by side.